01
Campaign Analytics Dashboard
Product Design, UX Research, SaaS


Omdevsinh
Active Plan
pro+
Credits
760.55
View Report
Add Influencers/Content
Share
Google Report June 2024
Objective :-
🎉 Brand Awareness
Edit
Brand
Budget
₹5,00,000
Re-calculate
Influencers
04
Deliverables
04
Description :-
Remember, these are general reasons, and the actual time taken for check clearance might vary based on specific circumstances, bank policies, and any changes in the banking system. Always check with your bank for precise information regarding check clearance times.
Overview
Top Performer
Influencers
Content
Google Trend
Conclusion
Manage Section
Statistics Overview
Customize
Sharing Status
Visible
Views
238.9K
Likes
6.7K
Comments
6.7K
Engagement Rate
424.34
CPE
238.9K
Planned CPV
424.34
Delivered CPV
424.34
IG Reach
6.7K
Impressions
6.7K
Views/Subscriber Ratio
424.34
Share
238.9K
Sticker Taps
238.9K
Saves
6.7K
Clicks
6.7K
Planned Views
424M
Replies
6.7K
Profile Engagements
424.34
Submissions
6.7K
Remixes
424.34
Conversions
424.34
Influenzer.io
https://app.influenzer.io
Overview
CultureX provides tools for campaign execution, management, and performance analytics via their platform ‘Influenzer’ tailored for creators and brands.
For campaign reporting, it often involves aggregating data from various platforms, leading to inconsistent metrics and a lack of actionable insights. Additionally, the absence of real-time updates slows decision-making for marketers and brands.
I led the design of the campaign reporting tool, addressing these challenges by creating an intuitive, centralized system for tracking, analyzing, and sharing campaign performance.
My Role
UI/UX Designer
UX & Market Research
Competitor Analysis
Visual Design & Prototyping
View Live Product
The Problem
Campaign managers, brand representatives, and marketing teams had difficulty tracking campaign data from multiple influencers, leading to fragmented reporting and delayed insights. They required an intuitive tool that provided precise, real-time analytics to streamline their decision-making process.
Here are some of the problems that they faced:
Lack of real-time updates.
Overwhelming raw data made it challenging to derive actionable insights.
Manual data tracking processes were time-consuming and prone to errors.
Limited visibility into individual influencer performance.
Lack of interactive visualizations to identify trends and patterns effectively.
RESEARCH
Stakeholder Interviews
Conducted 12 interviews with stakeholders where 5 were Campaign Managers, 4 were
Brand Representatives and 3 were Marketing Analysts.
The Objective was to identify user needs, challenges, and expectations for a reporting tool that tracks, analyzes, and shares campaign performance data efficiently. Here are some of the questions asked:
What metrics do you find most critical when evaluating a campaign's success?
How do you currently collect and aggregate performance data?
What challenges do you face in creating and sharing campaign reports?
What features would you find most helpful in a reporting tool?
How often do you need real-time updates for campaign performance?
Interview Findings
Data Fragmentation: Most users struggled with consolidating data from multiple platforms
Time Consumption: Manual processes for data aggregation delayed reporting by 2–3 days on average.
Inconsistent Metrics: Lack of standardized metrics made it difficult to compare influencer performance.
Visualization Preferences: Users preferred simple graphs for trend tracking and tables for detailed metrics.
Sharing Challenges: Clients needed concise, customizable reports with clear visuals.
User Personas
Created user personas to represent key stakeholders of the campaign reporting tool, ensuring the design aligned with their needs. Insights from user interviews and surveys were analyzed to identify common behaviors, goals, and challenges, resulting in three primary personas.

Maya Patel
Goals
Streamline reporting workflows to save time.
Monitor influencer performance in real-time.
Needs
Customizable dashboards with relevant KPIs.
Easy-to-generate reports for internal and client presentations.
Frustrations
Manually aggregating data from multiple platforms is tedious.
Difficulties in comparing influencers across campaigns.
Age: 32 years
Role: Marketing Campaign Manager

John Williams
Age: 40 years
Role: Senior Brand Manager
Goals
Needs
Intuitive graphs and summary views.
Branding options for client-facing reports.
Frustrations
Gain high-level insights into campaign ROI.
Share reports with stakeholders quickly and efficiently.
Reports often lack clear, concise visuals.
Limited customization options for branding.

Sarah Chen
Advanced filtering and sorting tools.
Needs
Exportable datasets for further analysis in third-party tools.
Goals
Frustrations
Dive deep into detailed campaign metrics.
Identify trends and patterns for optimization.
Generic dashboards make it hard to perform advanced analyses.
Lack of granular data filtering options.
Age: 27 years
Role: Data Analyst
Competitor Analysis
An analysis to evaluate the features, reporting capabilities, and performance tracking strengths of influencer marketing platforms like HypeAuditor, Influencity, and Qoruz in order to identify:
Gaps in existing tools that can be addressed in the design of a new campaign reporting tool.
Opportunities for differentiation by incorporating advanced customization, user-centric dashboards, and localized insights.
Key strengths and limitations to ensure the new tool aligns with industry standards while offering unique value propositions.
Feature

HypeAuditor

Influencity

Qoruz
Customizable Reports
Real-Time Analytics
Custom Report Creation
Live Report Sharing
Visual Data Representation
Clean
Simple
Regional Focus
Usability (UI/UX)
Good
Good
Moderate
Customizable Reports
Real-Time Analytics
Custom Report Creation
Live Report Sharing
Data Representation
Usability UI/UX
HypeAuditor
Influencity
Qoruz
100
80
60
40
20
0
Actionable insights from Analysis:
Improve Custom Report Creation
Offer flexible tools to create reports tailored to their needs.
Enhance Real-Time Analytics
Prioritize live, real-time performance tracking.
Focus on Regional & Global Insights
Combine regional trends with global performance insights.
Optimize Data Visualization
Ensure an intuitive design with interactive visualization for better UX.
Strengthen Live Report Sharing
Streamline real-time sharing features to boost user engagement.
THE DESIGN
Dedicated Report Module
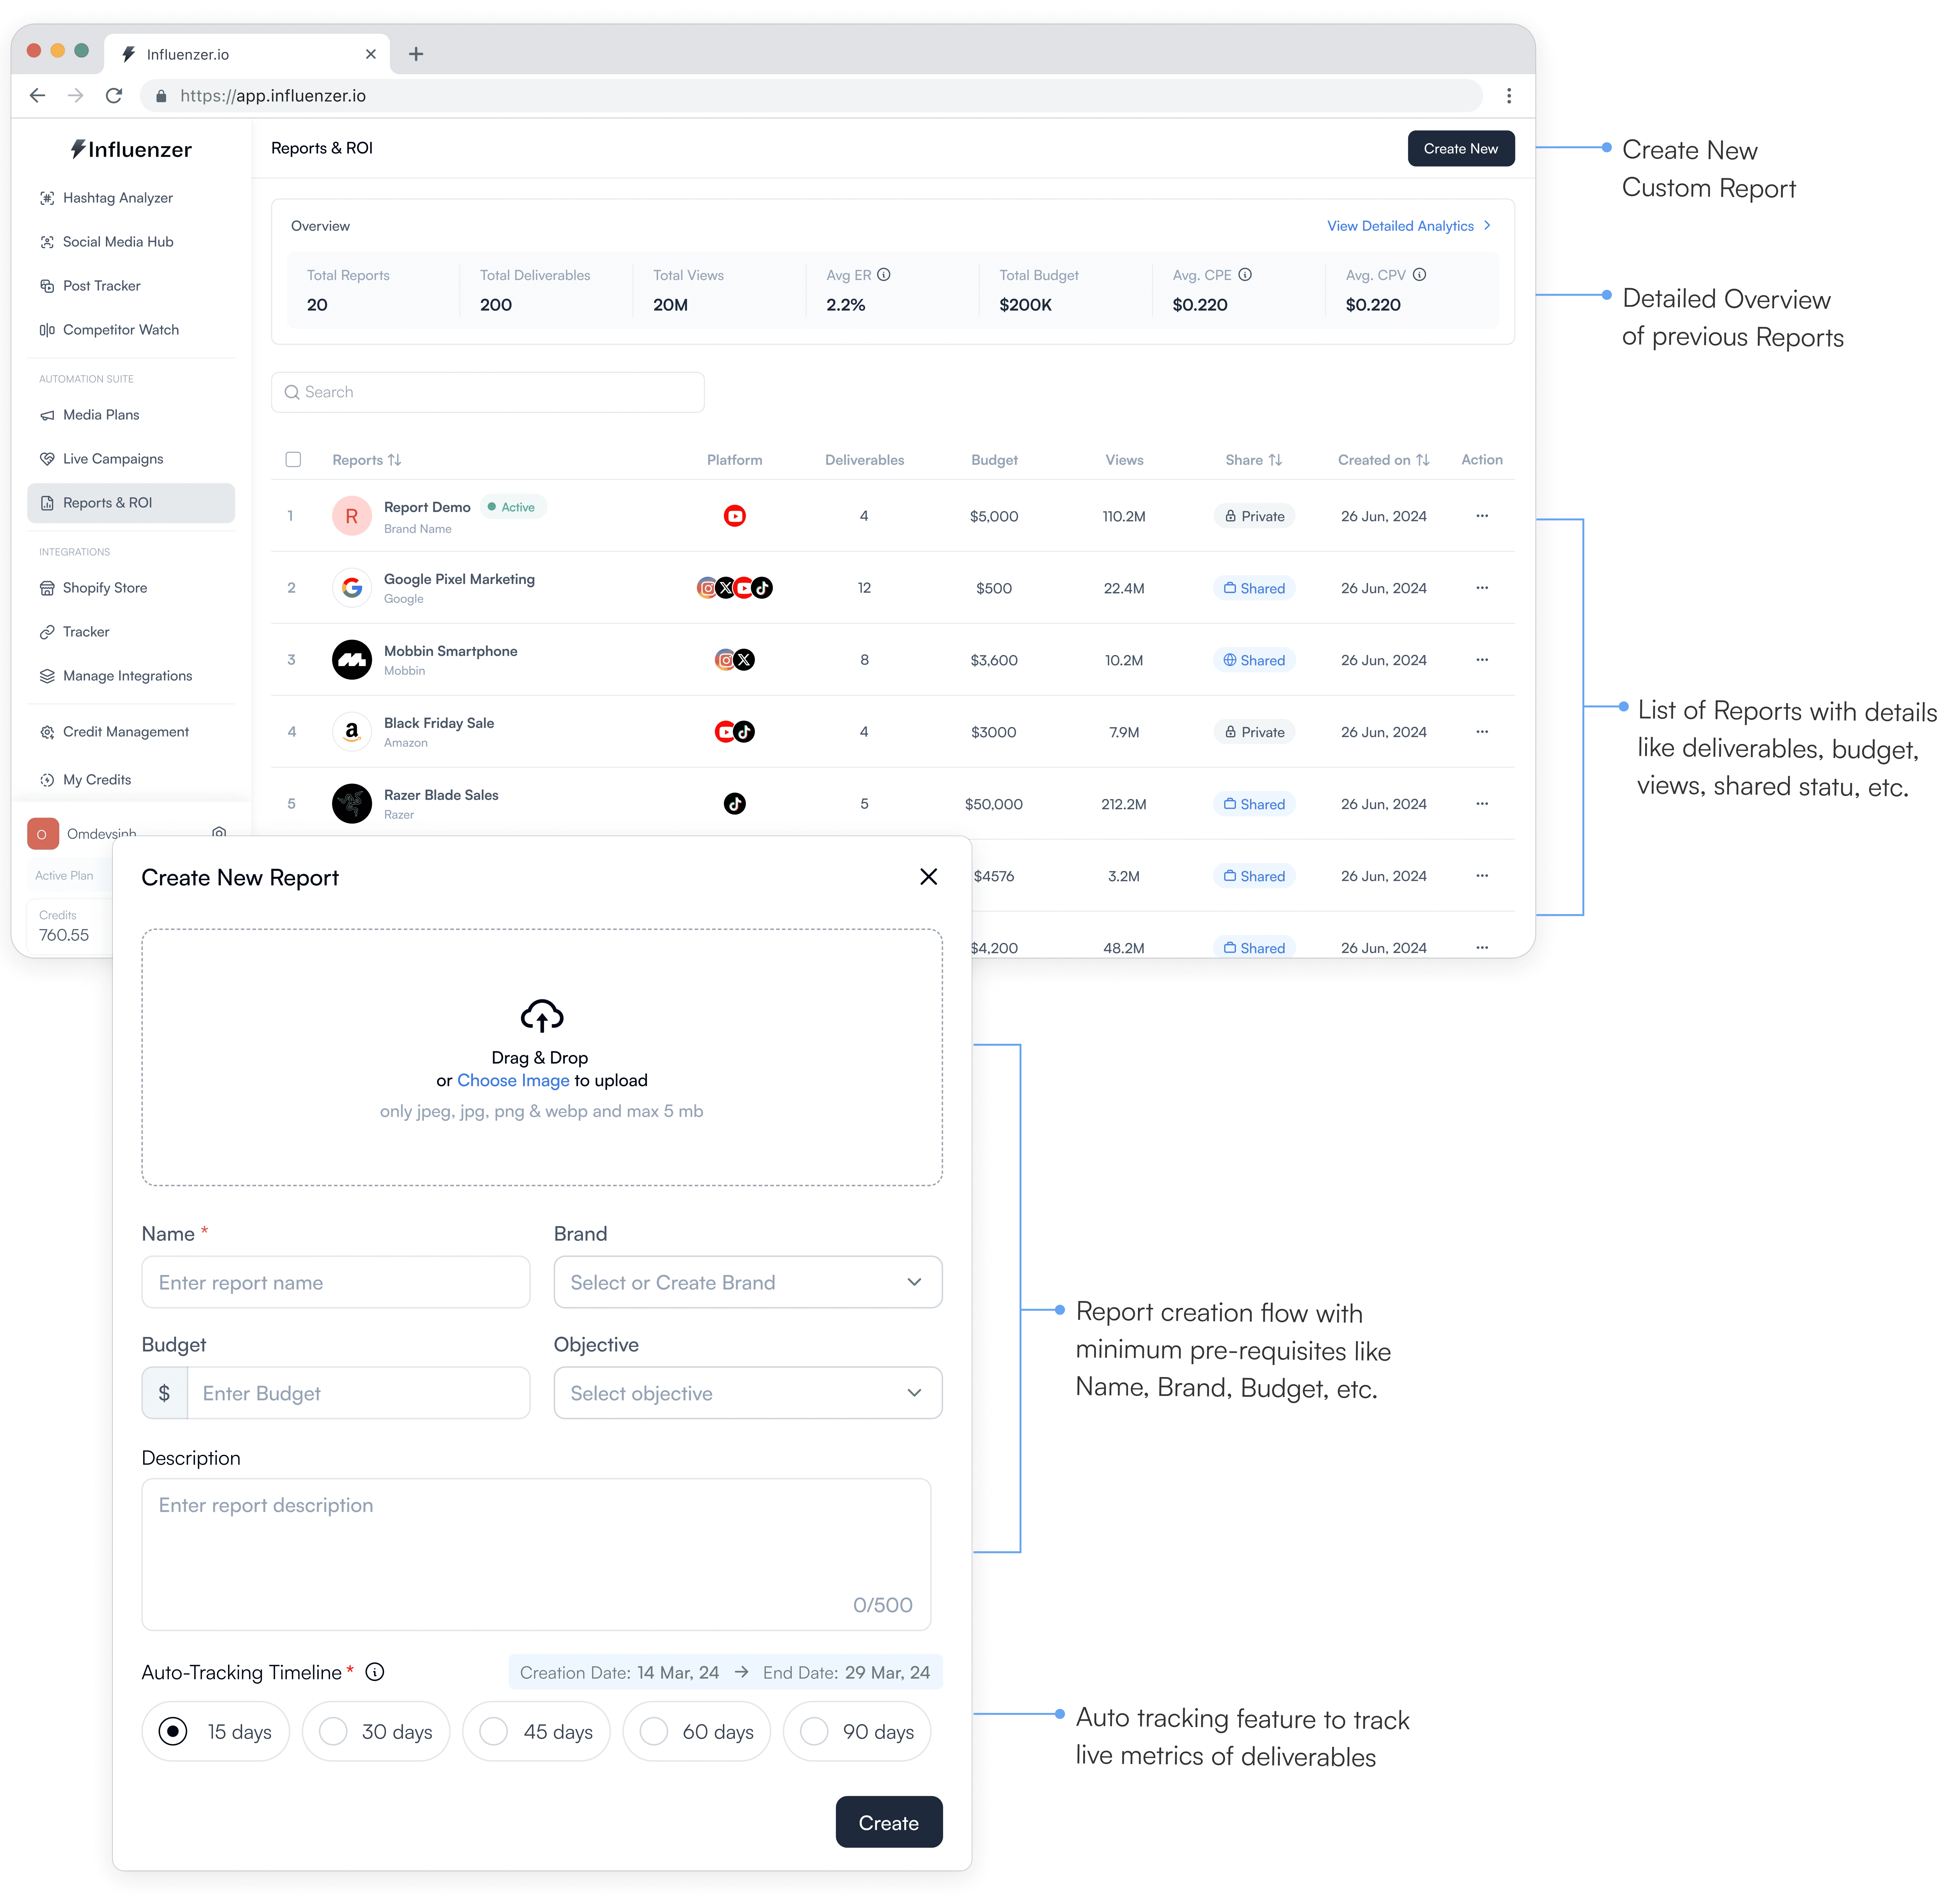
Detailed Report View
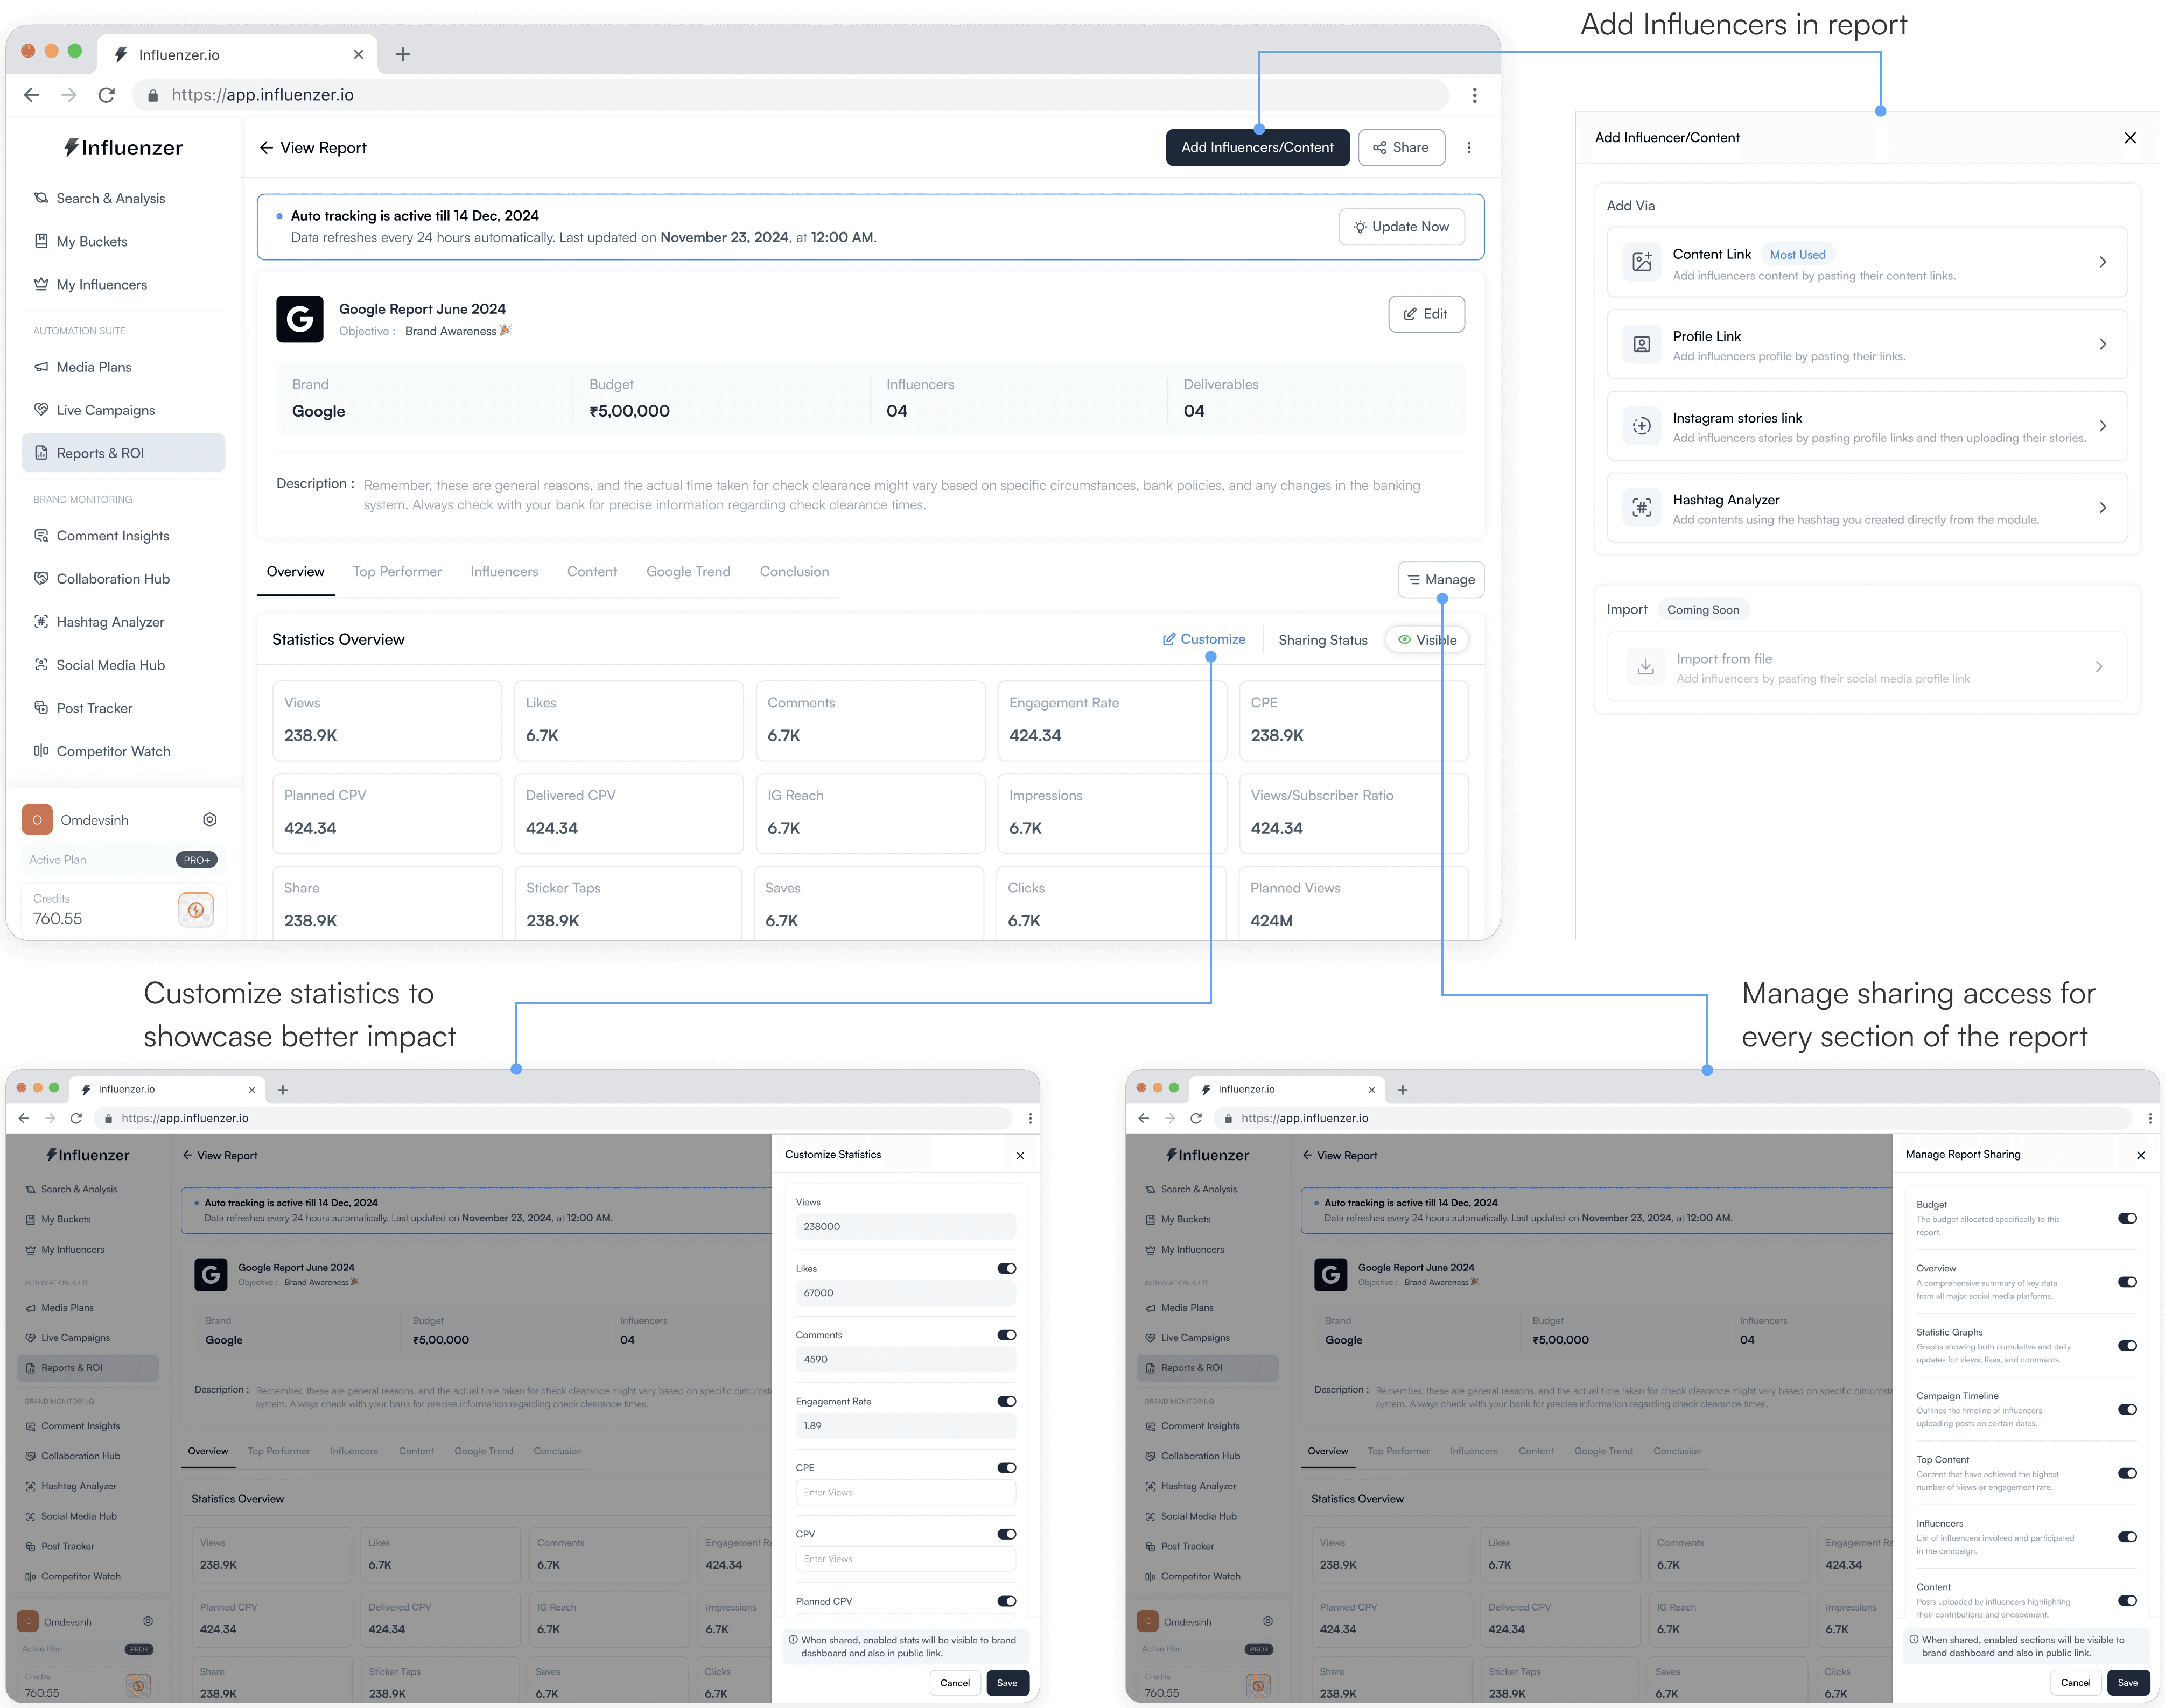
SHARING REPORT WITH BRAND


Omdevsinh
Active Plan
pro+
Credits
760.55
View Report
Add Influencers/Content
Share
Google Report June 2024
Objective :
Brand Awareness 🎉
Edit
Brand
Budget
₹5,00,000
Influencers
04
Deliverables
04
Description :
Remember, these are general reasons, and the actual time taken for check clearance might vary based on specific circumstances, bank policies, and any changes in the banking system. Always check with your bank for precise information regarding check clearance times.
Overview
Top Performer
Influencers
Content
Google Trend
Conclusion
Manage
Statistics Overview
Customize
Sharing Status
Visible
Views
238.9K
Likes
6.7K
Comments
6.7K
Engagement Rate
424.34
CPE
238.9K
Planned CPV
424.34
Delivered CPV
424.34
IG Reach
6.7K
Impressions
6.7K
Views/Subscriber Ratio
424.34
Share
238.9K
Sticker Taps
238.9K
Saves
6.7K
Clicks
6.7K
Planned Views
424M
Replies
6.7K
Profile Engagements
424.34
Submissions
6.7K
Remixes
424.34
Conversions
424.34
Influenzer.io
https://app.influenzer.io
Export Report
The PDF will be available for download in some time. Additionally, we will send it directly to the email.
No. of Deliverables
04
File format
omdevsinh1205@gmail.com
This email will be used to send the generated PDF copy.
Cancel
Generate PDF
Invite Brand
Google Report June 2024...
🎉 Brand Awareness
4 Deliverables
Brand
Select Brand
Share
Public Link
Share the public link with anyone you wish.
Copy Link
1
3
2
Either invite a brand on the live report dashboard by Sign In feature or share a Public Link to the brand.
Export whole report to a PDF File and get options to download it and also shooting it to personalized email.
MISSION RESPONSIVE
But What Next?
While conducting research, it was found that most of the brand executives and campaign managers use
Mobile Phones to view and track campaign reports. This gave rise to work upon another design solution which focused on:
Designing a clean, mobile-first interface with intuitive navigation and easily accessible metrics.
Ensuring essential data points and performance summaries are prominently displayed for quick insights.
Adapting charts and graphs for mobile, enabling seamless scrolling, zooming, and tapping for detailed views.
Creating responsive UI elements that adjust effortlessly to different screen sizes and orientations.

Report Overview

Google Report June 2024
Objective :-
🎉 Brand Awareness
Brand
Budget
₹5,00,000
Influencers
04
Deliverables
04
Description :-
Remember, these are general reasons, and the actual time taken for check clearance might...Read More
Statistics Overview
Views
238.9K
Likes
6.7K
Comments
6.7K
ER%
424.34
Content Type
424.34
Planned Views
424.34
Share
238.9K
Saves
6.7K
Clicks
6.7K
CPE
238.9K
Replies
6.7K
Conversions
424.34
Report Overview with key information & description
Navigation to swap between report sections
Overall Statistics of campaign report
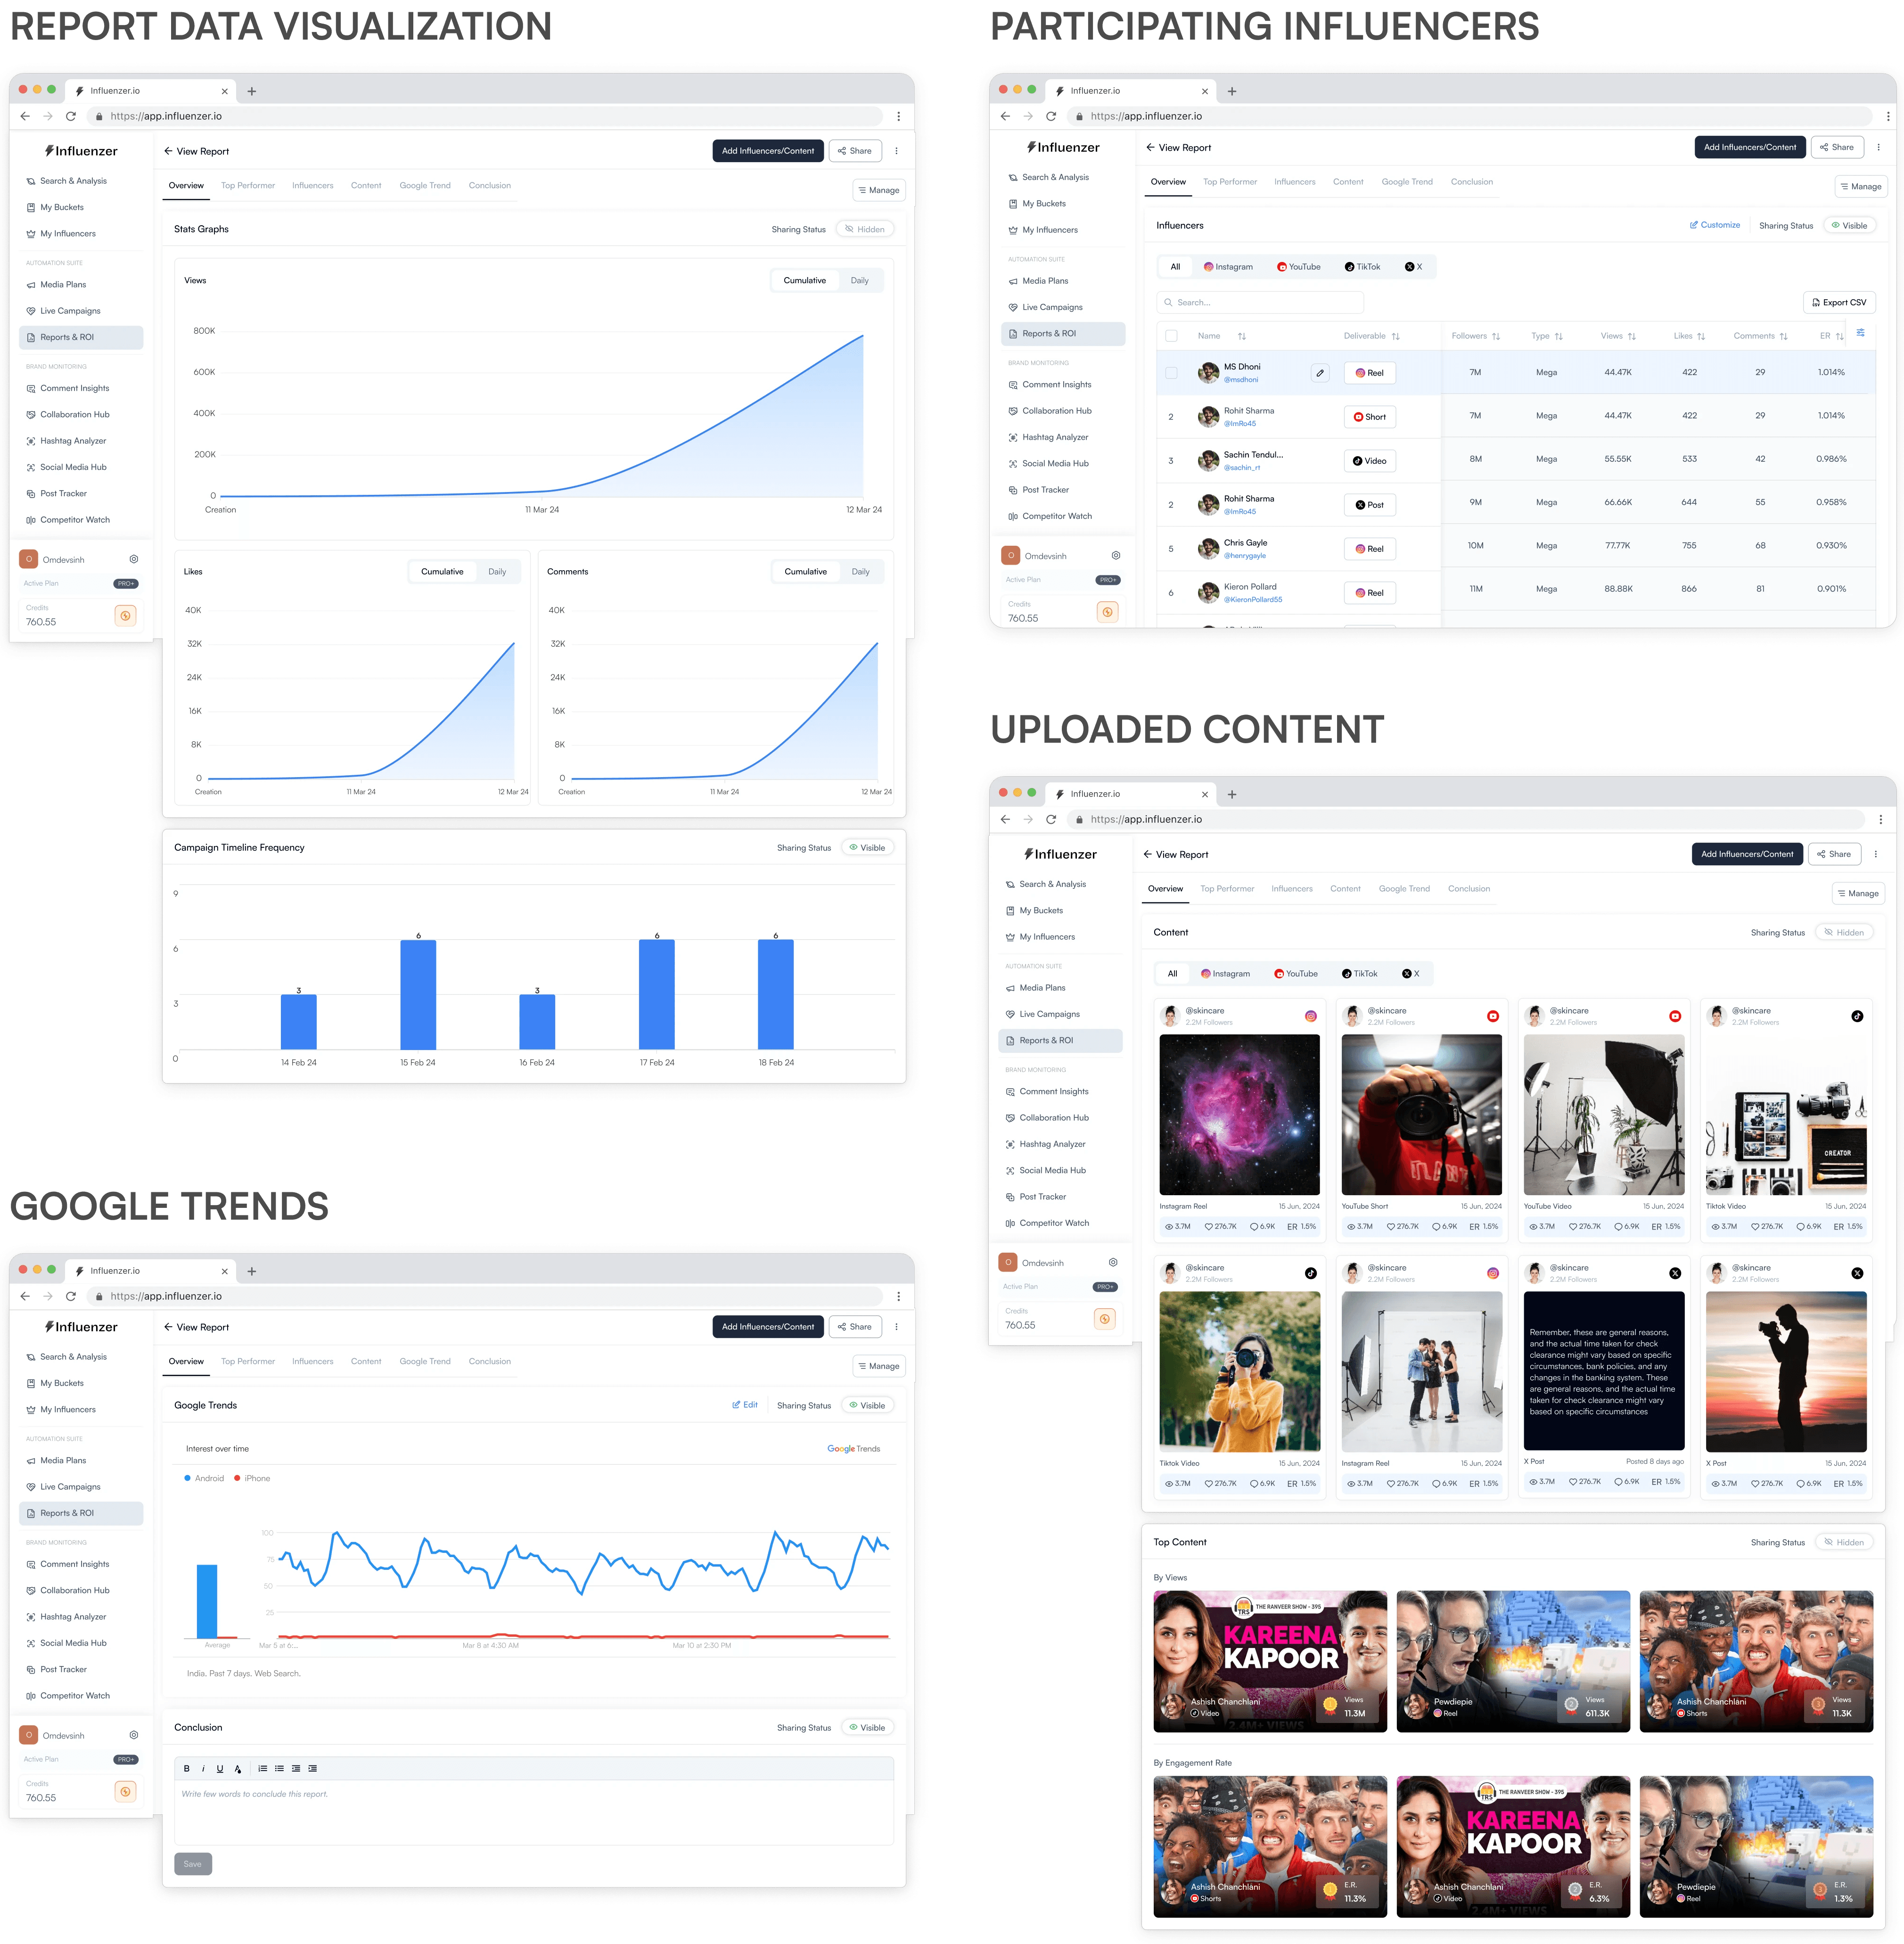
Statistics Graphs
Statistics Graphs
Views
Cumulative
Daily
Campaign Timeline
3
2
1
0
Visual representation of important data like views, likes and comments through graphs.
Scrollable graph for more flexibility and accessibility
Influencers/Deliverables
All Media
Export CSV
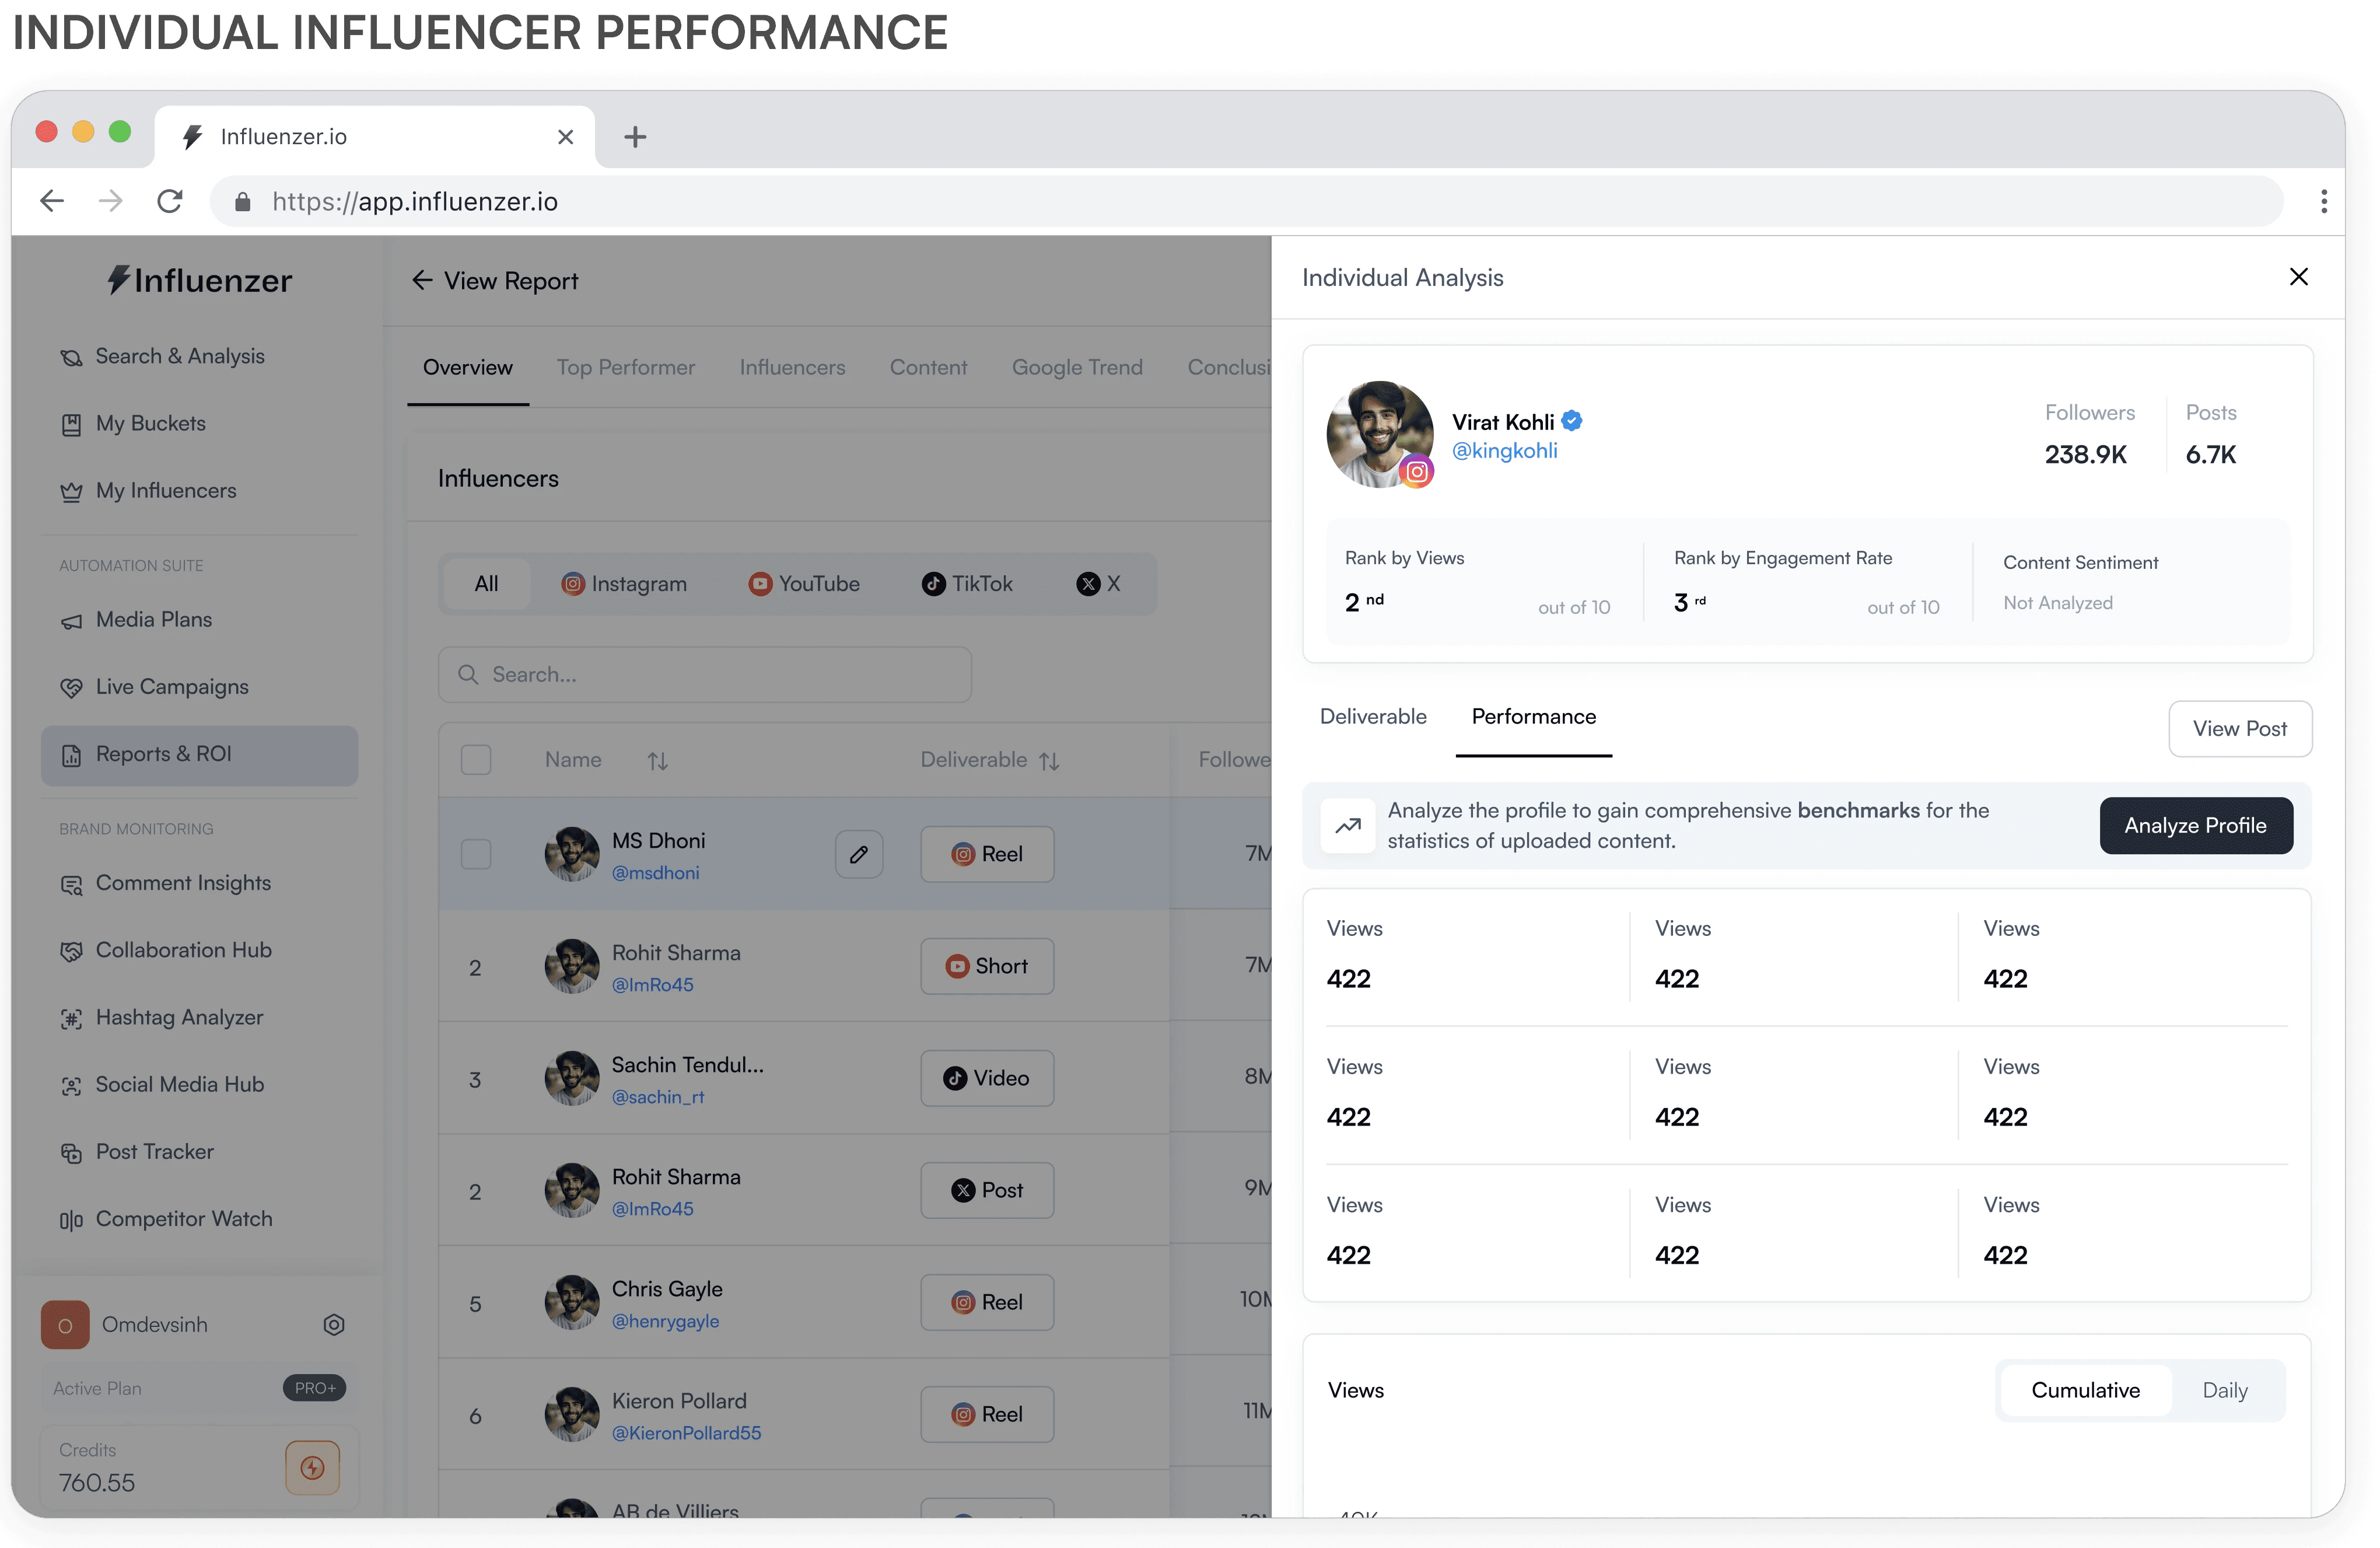
Click on deliverable to view individual performance.
Name
Deliverable
Followers

Virat Kohli
@viratkohli
Reel
234M
Rohit Sharma
@iamcaptain
Short
80M
Sachin Tendulkar
@godofcricket
Video
8.5M
MS Dhoni
@mahiforever
Post
9.3M
Chris Gayle
@universalboss
Reel
9M
Kieron Pollard
@pollardk
Reel
4.6M
A B DeVilliers
@mr360
Reel
3.2M
Kane Williamson
@blackbird
Reel
5.8M
Andre Russel
@andressel
Reel
10M
David Warner
@nevermissacatch
Reel
13M
Content
All Media

4 days ago
The little ear bounce 🥹 On today’s #WeeklyFluff we
are striding toward the weekend with @2husketeers
(Hoya), a suitably well-dressed Jindo pup. Video by
3.7M
276.7K
6.9K
ER
1.5%

4 days ago
The little ear bounce 🥹 On today’s #WeeklyFluff we
are striding toward the weekend with @2husketeers
(Hoya), a suitably well-dressed Jindo pup. Video by
3.7M
276.7K
6.9K
ER
1.5%
Options to swap between media and to export CSV of influencers list
Get more details about deliverables of specific influencers
View social media platform of specific influencers directly
View, Track and Analyze the uploaded content
Top Content
By Views
By Engagement Rate

Ashish Chanchlani
Video
Views
11.3M

Pewdiepie
Reel
Views
611.3K

Ashish Chanchlani
Shorts
Views
11.3K
Conclusion
The recent "Summer Sparkle" campaign successfully exceeded our expectations in both reach and engagement. With a strategic mix of influencer partnerships, targeted content, and comprehensive social media activities, we achieved significant milestones. The campaign generated over 1 million impressions, 500,000 engagements, and a 25% increase in brand awareness.
Key Achievements:
High Engagement Rates: The influencers' posts received an average engagement rate of 8%, well above industry standards.
Increased Brand Mentions: There was a 30% increase in brand mentions across all platforms.
Strong Influencer Collaboration: Influencers effectively communicated our brand message, resulting in positive audience sentiment and increased follower growth.
Top 3 content of influencers in campaign
View top content by number of Views and Engagement Rate
Conclusion of campaign report to analyze Impact & Achievements
THE IMPACT
After the launch of first MVP of Reporting Module, the platform supported 20M+ influencers for
campaign collaboration and campaign report generation.
Improved Workflow Efficiency
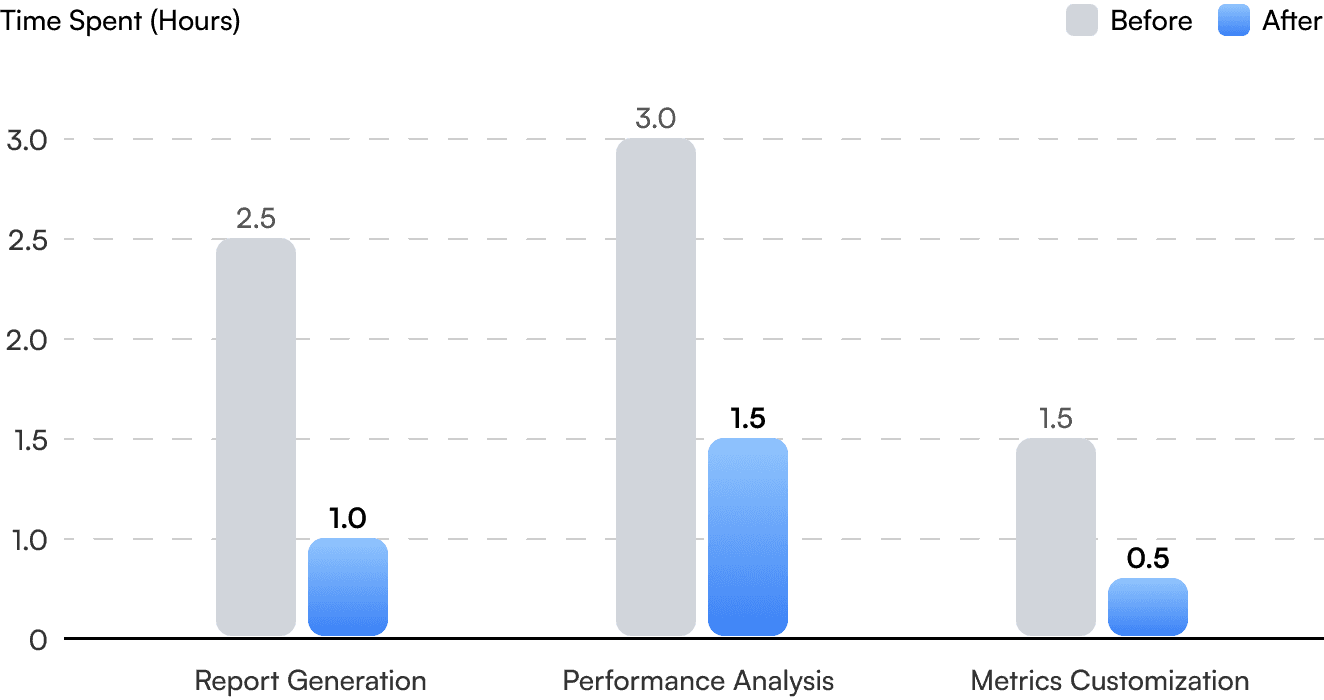
Time required for report generation decreased from 2.5 hours to 1 hour, reflecting a 60% boost in productivity.
Streamlined analysis from 3 hours to 1.5 hours, enabling faster and more informed decision-making.
Optimized customization from 1.5 hours to 0.5 hours, achieving a 66% increase in operational efficiency.
User & Usage Growth
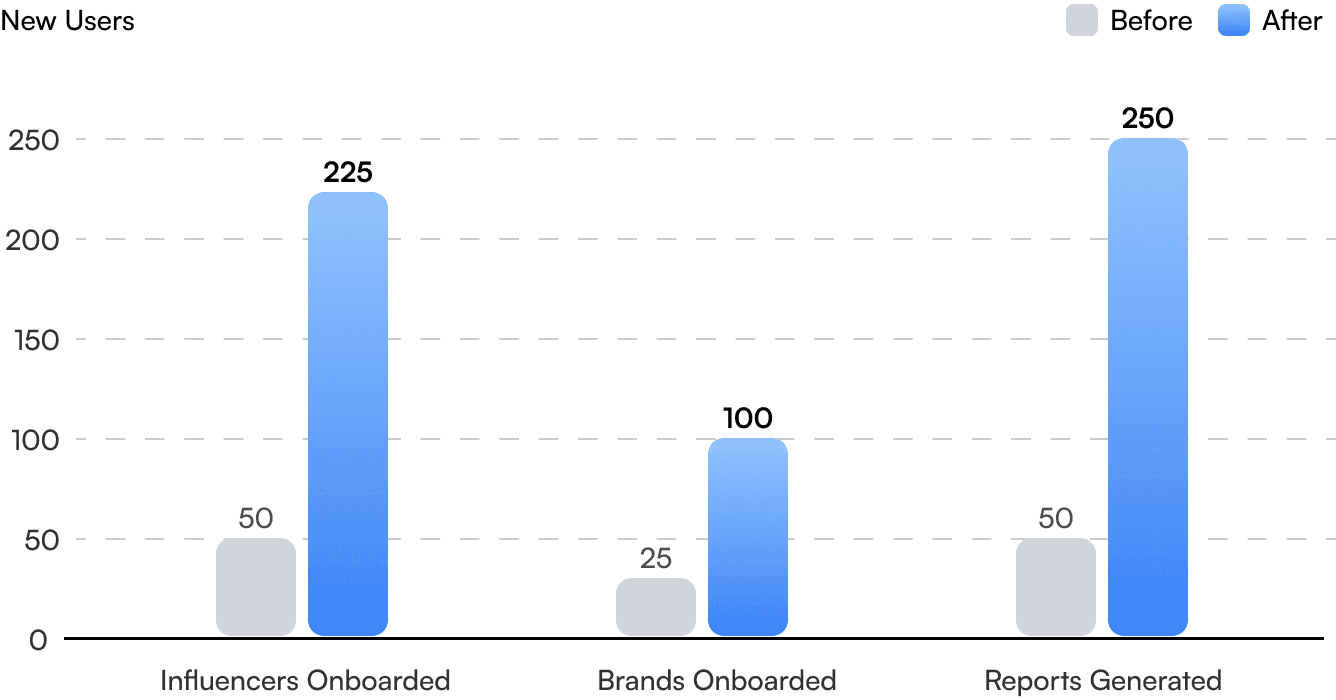
No. of influencers expanded from 50 to 225 users, demonstrating a 350% growth in influencer adoption.
Increase in no. of brands showcased a 300% rise in brand engagement
Report generation scaled from 50 to 250, highlighting a 400% surge in reporting activity and tool utilization.
Key Takeaways
User-Centric Design Drives Success:
Conducting comprehensive research, including stakeholder interviews and competitor analysis, was pivotal in identifying pain points and tailoring solutions to user needs. This reinforced the importance of designing intuitive workflows to enhance adoption and satisfaction.
Iterative Development for Maximum Impact:
Designing the reporting and sharing modules from scratch involved a continuous cycle of prototyping, testing, and refinement. This iterative approach ensured the final product aligned with user expectations and improved efficiency.
Scalable Design Principles:
Balancing functionality and scalability was essential in creating a responsive design. The ability to meet both mobile and web usage scenarios highlighted the significance of flexibility in SaaS design for diverse user environments.